Credits Successfully Completed – Fall
Successful completion of attempted credits propels students toward the achievement of their educational goals. A higher credit completion rate increases the likelihood that students will efficiently progress through their academic pathways, saving both time and financial resources.
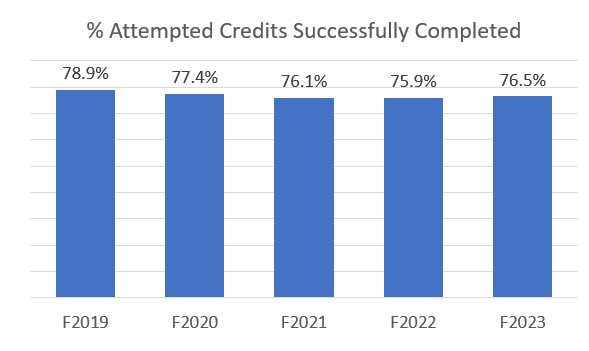
Successful completion rates for fall credits range from a low of 75.9% (fall 2022) to a high of 78.9% (fall 2019), with the fall 2023 rate slightly surpassing those of the two most recent fall terms.

Equity Gaps
Equity gap refers to any disparity along racial, socioeconomic, gender or other demographic grouping. These gaps lead the college to ask “what processes, policies or practices are in place that create or exacerbate these disparities? ”
| Fall 2023 Rates by | Range (low to high) | Equity Gap |
|---|---|---|
| Gender | 76.0% to 76.9% (Male to Female) | <1% point |
| Pell Status | 72.5% to 78.9% (Awarded Pell to No Pell) | 6.4% points |
| Race/Ethnicity | 58.4%, 63.5% to 82.3% (Hawaiian/Pacific Islander, American Indian/Alaskan Native to Asian) | 23.9% points |
| Age | 74.1% to 81.1% (Under Age 20 to Age 30 and older) | 7.0% points |
| First Generation | 73.4% to 79.5% (1st Gen to Not 1st Gen) | 6.1% points |
Fall 2023 Findings
- The gender equity gap is near zero while the race/ethnicity equity gap is the highest.
- Students who are not awarded Pell grants successfully complete more attempted credits than do Pell recipients.
- Older students, on average, complete a higher percentage of credits than younger students.
- Individuals with a parent or guardian who have a four year degree, successfully complete a higher percentage of credits than do first generation students.
- Students who identify as Asian complete more attempted credits than any other race/ethnicity group.
Race/ethnicity Fall 2023 Credit Completion Rate 5-Year Range (low to high) American Indian/Alaska Native 63.5% 63.5% (F2023) to 72% (F2019) Asian 82.3% 80.7% (F2022) to 83.7% (F2019) Black/African American 66.1% 63.8% (F2020) to 67.8% (F2019) Hispanic or Latino 71.1% 69.0% (F2021) to 75.1% (F2019) Native Hawaiian/Pacific Islander 58.4% 58.4% (F2023) to 71.5% (F2019) Two or more races 74.4% 73.5% (F2021) to 77.6% (F2019) Not Reported 81.7% 78.7% (F2019) to 81.7% (F2023) White 79.2% 78.9% (F2022) to 80.2% (F2019)
Equity Gap Trends
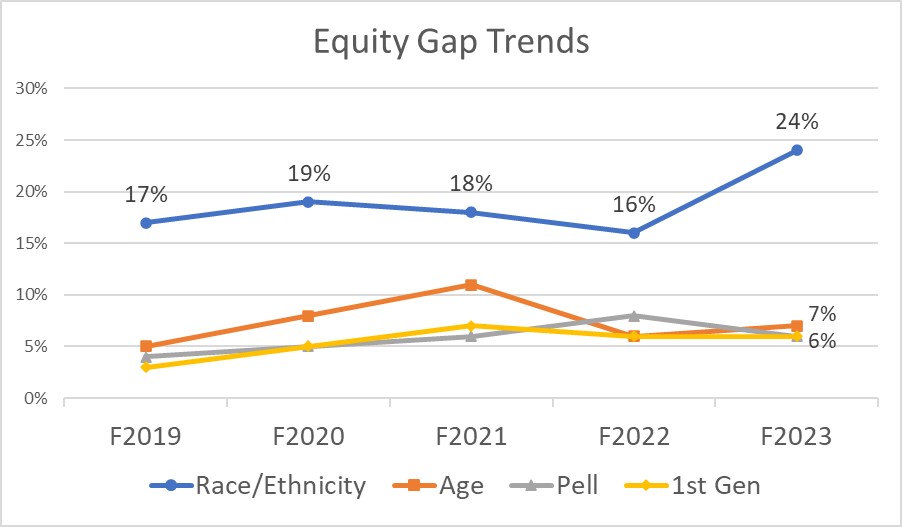
A downward sloping line indicates progress toward reducing existing equity gaps while an upward sloping line signals an increasing gap. Equity gaps in fall 2023 were similar to fall 2022 with the exception of an increase in the race/ethnicity gap.

Notes:
Successful Credit Completion Rate = # of credits completed with grades A, B, C, P divided by total credits attempted (including grades W)
Equity gap = highest credit completion rate – lowest credit completion rate
Data Source: Argos, YESS, Successful Credits Completed, January 2024
