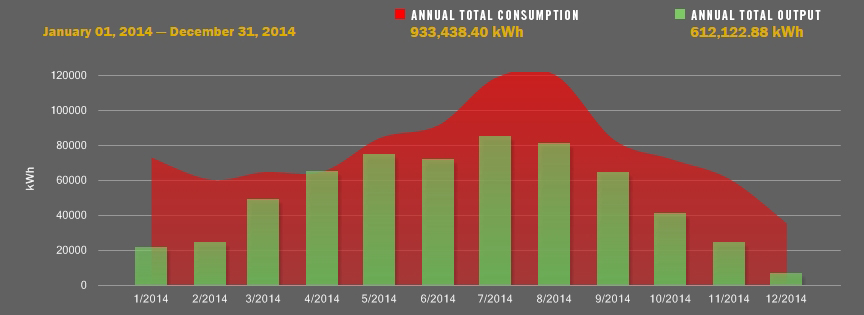
SolarCity's online monitor allows readers to see how much power the solar array is generating for Rock Creek's Building 9 by the hour, day, week, month or year. The green bars represent the amount of power generated, the red ??? shows how much power is being used.
View full size