The 2021 update set a new target date of 2040 for Carbon Neutrality from Scope 1 & 2 emissions. Using science-based targets as the model for reduction, PCC took the available information on the college’s emissions and aligned the reduction targets so that PCC’s contribution to limiting global warming would not exceed 1.5°C. In support of equitable climate action, PCC must work to limit climate change contributions in alignment with a global need for GHG emissions not to exceed 1.5°C, which is the threshold scientists have identified to protect many low-lying and island nations from disastrous sea level rise.
In addition to setting new carbon neutrality targets, the plan outlines five-year goals to be met in the areas of all Scope 1 and 2 GHG emissions, currently tracked Scope 3 GHG emissions, education and outreach and resiliency. Equity is embedded throughout PCC’s Climate Action Plan.
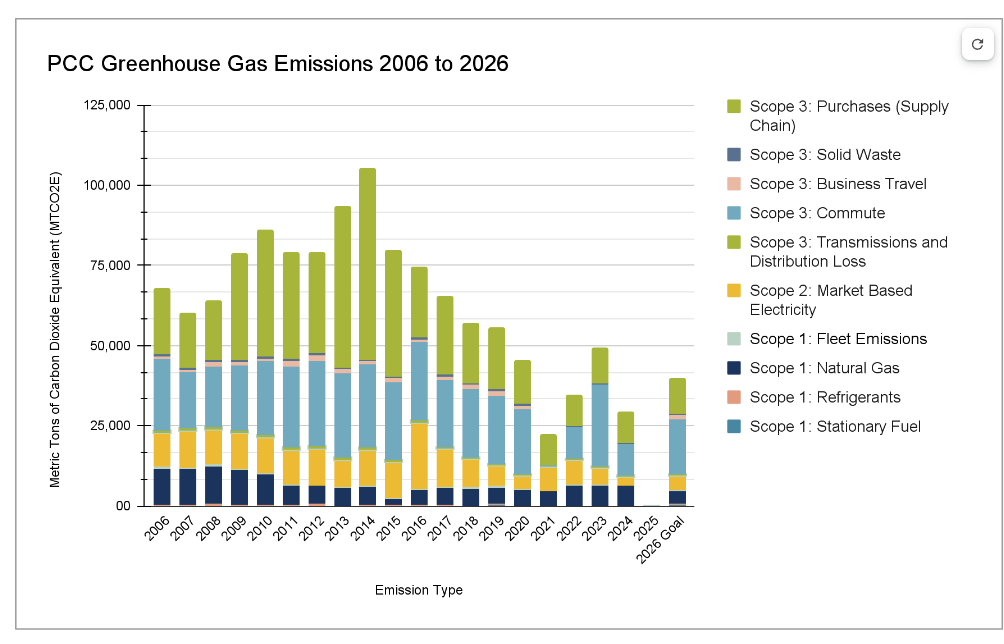
About PCC’s Greenhouse Gas Emissions
PCC’s greenhouse gas emissions are influenced by student and educational needs, building and systems design, fuel choices, operational efficiency, and individual behaviors such as purchasing and commuting choices. We look at our emissions in terms of the amount of direct influence we have and divide them by scope accordingly.
Our Scope 1 & 2 emissions chiefly consist of emissions from heating and lighting buildings and running electrical equipment. It is also where PCC has the greatest opportunity to influence change, through green building design and improvements in operations, energy efficiency, and education and outreach.
Our Scope 3 emissions are more challenging to both measure and influence. They include emissions from commuting to the college by both staff and employees, college purchases of goods and services and from business travel. Because of their indirect nature, both supply chain emissions and commuting emissions have unique challenges in terms of measuring change. While we have undertaken many significant projects to reduce the emissions from our supply chain through greener purchasing, supply chain emissions are chiefly measured by spending and it is difficult to separate green spending from non-green spending at this time. Furthermore, commuting emissions tend to fluctuate with student enrollment and while significant commuters utilize alternative transportation, the sheer number of people commuting to campus each day overshadows this.
Between 2006 and 2023, we reduced our emissions at PCC from operating our Buildings and Grounds (Scope 1 & 2 emissions) by about 47% with net emissions of 12,069 metric tons of carbon dioxide equivalent (MTCO2E) compared to 14,243 MTCO2E in 2022 and 12,819 MTCO2E in 2019 (our last full year of reporting prior to the pandemic).
In FY 2023, the college purchased and produced a combined ~17,510,381 kWh of renewable energy credits which reduced the college’s carbon footprint by 4670 MTCO2E, from subscriptions to Portland General Electric’s Renewable Energy Credit programs: Green Future Enterprise and Green Future Impact as well as Oregon Shine’s Community Solar program. When the first full year of savings happens in fiscal year 2025, the college expects to achieve net annual average savings of approximately $19,100 per year for the next twenty-two years.
Greenhouse gas emissions from building energy use has dropped about 32% since 2006, despite significant college expansion.
Overall, we’ve become more energy efficient by decreasing our total building energy consumption use per square foot by about 49%. PCC’s innovative investment in LEED certified green buildings, lighting upgrades, and behavior change programs such as Power Shift and Panther Print have historically helped to reduce energy use and climate change impacts; however, an increase in the operating hours and outside air due as a response to COVID-19 contributed greatly to an increase in the use of both electricity and natural gas, which reduced energy savings in FY 2023. Continued investment in energy efficiency projects including the retro-commissioning of Cascade Student Services Building along with and the pursuit of strategic scheduling of PCC buildings, and Strategic Energy Management will continue to reduce electricity and natural gas consumption throughout the district.
Overall Scope 3 emissions still made up the largest share of PCC’s emissions at 75%. Scope 3 emissions are tightly tied to commuting and purchasing, both of which historically shift with our student enrollment levels.
The largest contributor to Scope 3 emissions in FY 2023 were commuting emissions, which made up about 52% of the Scope 3 emissions, while emissions from purchases (aka our supply chain) made up the majority of the remainder of Scope 3 emissions at around 22%. Business travel and solid waste combined made up less than 3% of the remaining emissions.
Supply emissions were unusually low this year. Lowered spending across the college seems to be the reason. For example, dining services are not fully open; therefore dining services spending is down.
The college delayed its transportation modality survey for students from the fall of FY 2023 to the fall of FY 2024. In FY 2023, we used a shortened number of days for employee commuting based on the FY employee survey, this was due to a reduction in normal operations; however the college has been fully open for classes.
While it’s clear from our enrollment data that more and more of our student population is returning to campus, the college’s 2024 transportation modality survey in the fall of FY 2024 for students will improve the overall accuracy of our commuting emissions. The last useful data was gathered in FY 2020, which when applied to the FY 2023 campus population, probably did not reflect the numbers of students attending school remotely and so the commuting figure was likely too high.
Purchasing and waste habits also impact Scope 3 emissions. The Sustainability Department is working closely with the Purchasing Department and other college buyers to advance sustainable purchasing practices. While we saw a reduction in waste-related emissions, it’s important to recognize that more students are taking courses on-line and overall enrollment is down. In turn, student-facing areas such as Dining Services are likely to have reduced on-campus waste.